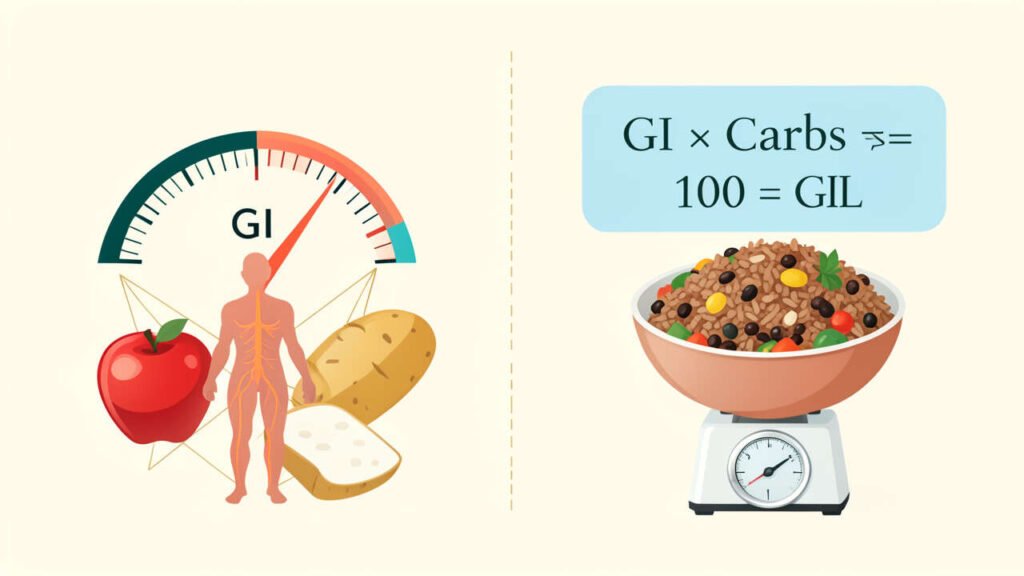
The key difference between glycaemic index and glycaemic load is that GI ranks carbohydrates by how quickly they raise blood sugar, while GL combines this speed with the actual amount of carbohydrate in a serving. This means glycaemic load provides a more accurate picture of a food's real-world impact on blood glucose levels. Understanding this distinction is crucial for making informed dietary choices to manage energy, weight, and conditions like diabetes effectively.
Glycaemic index vs glycaemic load is one of the most important comparisons you can understand when managing your diet, blood sugar levels, or overall health. These two terms sound similar, but they measure carbohydrates in very different ways.
Knowing the difference helps you make smarter food choices – whether you have diabetes, want to lose weight, or simply want steady energy throughout the day. This guide breaks down exactly how each metric works, where they differ, and which one you should pay attention to.
Simply put, the glycaemic index (GI) ranks carbohydrates by how quickly they raise blood sugar, while the glycaemic load (GL) accounts for both the speed and the actual amount of carbs in a typical serving. GL gives you a more complete picture of a food’s real-world effect on blood sugar.
Key Takeaways
- Glycaemic index measures how fast a carbohydrate-containing food raises blood glucose on a scale from 0 to 100.
- Glycaemic load combines the GI value with the actual carbohydrate content in a serving, giving a more accurate blood sugar impact.
- A food can have a high GI but a low GL if the serving size contains very few carbohydrates.
- GL is generally considered the more practical and reliable metric for everyday meal planning.
- Both metrics were developed by researchers at the University of Toronto in the early 1980s.
Quick Comparison: Glycaemic Index vs Glycaemic Load
Before diving into the details, here is a side-by-side overview of the two metrics. This table highlights the core differences at a glance.
| Feature | Glycaemic Index (GI) | Glycaemic Load (GL) |
|---|---|---|
| What it measures | Speed of blood sugar rise | Speed + amount of carbs consumed |
| Scale | 0-100 | No fixed upper limit (typically 0-40+) |
| Serving size considered? | No (uses standard 50g carb portion) | Yes (uses realistic serving sizes) |
| Low value | 55 or less | 10 or less |
| Medium value | 56-69 | 11-19 |
| High value | 70 or more | 20 or more |
| Year developed | 1981 | 1997 |
| Developed by | Dr. David Jenkins (University of Toronto) | Dr. Walter Willett (Harvard University) |
| Best for | Comparing carb quality | Comparing real-world blood sugar impact |
This table makes one thing clear: GI and GL are related but not interchangeable. GI tells you about the quality of the carbohydrates, while GL tells you about the combined effect of quality and quantity.
Tip: Think of GI as the “speed limit” on a road, and GL as your actual speed. A food might be on a fast road (high GI), but if you only take a tiny bite (small serving), you are not going far (low GL).
What Is the Glycaemic Index?
The glycaemic index is a ranking system that measures how quickly a carbohydrate-containing food raises your blood glucose levels after eating. It was developed in 1981 by Dr. David Jenkins and his team at the University of Toronto.
At its core, GI answers one simple question: how fast does the sugar from this food hit your bloodstream? Foods are ranked on a scale of 0 to 100, with pure glucose serving as the reference point at 100.
GI Categories
- Low GI (55 or less): Lentils, most fruits, non-starchy vegetables, rolled oats, sweet potatoes, chickpeas
- Medium GI (56-69): Whole wheat bread, brown rice, quick oats, certain tropical fruits like pineapple
- High GI (70 or more): White bread, white rice, potatoes, watermelon, cornflakes, pretzels
How GI Is Tested
The testing process is standardized. Researchers feed a group of healthy individuals a portion of food containing exactly 50 grams of digestible carbohydrates. They then measure blood sugar levels at regular intervals over the next two hours.
This result is compared to the blood sugar response from consuming 50 grams of pure glucose. The food’s GI is calculated as a percentage of that glucose response. According to the American Diabetes Association, this method provides consistent and reproducible results across different studies.
Limitations of GI
GI has a significant blind spot. It does not consider how much of the food you actually eat. The test uses a standard 50-gram carbohydrate portion, which does not reflect real-world serving sizes.
- A watermelon has a GI of about 76 (high), but a typical serving contains only about 11 grams of carbs.
- To consume 50 grams of carbs from watermelon, you would need to eat roughly 700 grams – over 4 cups.
- This makes GI alone misleading for foods you eat in small amounts.
Warning: Do not avoid a food solely because it has a high GI. The glycaemic index does not account for portion sizes, which is why glycaemic load was developed as a more practical tool.
How Does the Glycaemic Index Work in Your Body?
When you eat carbohydrates, your digestive system breaks them down into glucose. This glucose enters your bloodstream and raises your blood sugar level. The rate at which this happens depends on the type of carbohydrate.
Simple carbohydrates – like those in white bread, candy, and sugary drinks – break down quickly. They cause a rapid spike in blood glucose, which is why they have a high GI. Complex carbohydrates – like those in legumes, whole grains, and most vegetables – break down more slowly, resulting in a gradual rise.
Factors That Influence a Food’s GI
- Type of starch: Amylose (found in basmati rice) digests more slowly than amylopectin (found in sticky rice), giving it a lower GI.
- Fiber content: Soluble fiber slows digestion and reduces the GI. This is why oats have a lower GI than processed cereals.
- Processing level: Grinding, milling, and cooking break down the food structure, making carbs easier to digest and raising the GI.
- Ripeness (for fruits): Riper fruits have more available sugars and a higher GI. A green banana has a GI of about 30, while a ripe one can reach 60.
- Fat and acid content: Adding fat or acid (like vinegar or lemon juice) slows gastric emptying and lowers the GI of a meal.
- Protein pairing: Eating carbs with protein slows digestion and moderates the blood sugar response.
Why GI Matters for Health
Research published in the journal Diabetes Care shows that consistently eating high-GI foods is associated with a greater risk of type 2 diabetes, cardiovascular disease, and obesity. A meta-analysis of 37 studies found that each 5-unit increase in dietary GI was linked to an 8% higher risk of type 2 diabetes.
The mechanism is straightforward. High-GI foods cause rapid blood sugar spikes, which trigger large insulin surges. Over time, repeated insulin surges can lead to insulin resistance – a precursor to type 2 diabetes.
Low-GI foods produce a steadier, more manageable glucose response.
| Food | GI Score | Category |
|---|---|---|
| Lentils | 32 | Low |
| Rolled Oats | 55 | Low |
| Banana (ripe) | 51 | Low |
| Brown Rice | 68 | Medium |
| Whole Wheat Bread | 69 | Medium |
| White Bread | 75 | High |
| White Rice | 73 | High |
| Watermelon | 76 | High |
| Cornflakes | 81 | High |
Notice how watermelon and cornflakes both score high on the GI scale. But as you will see below, their glycaemic load values tell a very different story about how they affect your blood sugar in real portions.
What Is the Glycaemic Load?
The glycaemic load was developed in 1997 by Dr. Walter Willett and his colleagues at Harvard University. It was designed to address the biggest flaw in the glycaemic index: the fact that GI ignores how much carbohydrate you actually consume in a normal serving.
GL measures the total blood sugar impact of a realistic portion of food. It combines the quality of the carbohydrate (the GI value) with the quantity of carbohydrate in a typical serving. This makes GL a far more practical tool for everyday dietary decisions.
GL Categories
- Low GL (10 or less): Minimal impact on blood sugar. Safe to eat freely for most people.
- Medium GL (11-19): Moderate blood sugar impact. Best eaten in controlled portions.
- High GL (20 or more):strong> Significant blood sugar impact. Should be consumed sparingly, especially by people with diabetes or insulin resistance.
Examples of GL in Common Foods
Here is where the glycaemic load really shines as a practical metric. Let us look at the same foods from the GI table above, but now with their GL values based on typical serving sizes.
| Food | Typical Serving | Carbs in Serving | GI | GL | GL Rating |
|---|---|---|---|---|---|
| Watermelon | 120g (1 slice) | 11g | 76 | 8 | Low |
| Cornflakes | 30g (1 cup) | 26g | 81 | 21 | High |
| White Rice | 150g (cooked) | 41g | 73 | 30 | High |
| Lentils | 150g (cooked) | 18g | 32 | 6 | Low |
| Rolled Oats | 40g (dry) | 27g | 55 | 15 | Medium |
| Sweet Potato | 150g (medium) | 27g | 63 | 17 | Medium |
The watermelon example is the most revealing. Despite a high GI of 76, a normal serving of watermelon has a low GL of just 8. This means that eating a slice or two of watermelon will not cause a significant blood sugar spike, despite what its GI alone might suggest.
Important: The formula for glycaemic load is: GL = (GI x grams of carbs per serving) / 100. This simple calculation shows you the real-world impact of any food on your blood sugar.
How Is Glycaemic Load Calculated?
Understanding the calculation behind GL helps you apply it to any food, even those not listed in a database. The formula is straightforward and only requires two pieces of information: the food’s GI value and the amount of carbohydrate in your serving.
The GL Formula
GL = (GI x grams of carbohydrate per serving) / 100
Let us walk through a real example step by step. Say you are eating a medium apple:
- Find the GI: Apples have a GI of approximately 36.
- Find the carbs in a serving: A medium apple (about 182g with skin) contains roughly 25 grams of carbohydrate.
- Apply the formula: GL = (36 x 25) / 100 = 9.
- Interpret the result: A GL of 9 is low. A medium apple is a safe, blood-sugar-friendly snack.
Common GL Calculations
| Food | GI | Carbs (g) | Calculation | GL |
|---|---|---|---|---|
| Medium Apple | 36 | 25 | (36 x 25) / 100 | 9 |
| 1 Cup Pasta (cooked) | 49 | 43 | (49 x 43) / 100 | 21 |
| 1 Slice White Bread | 75 | 13 | (75 x 13) / 100 | 10 |
| 200g Baked Potato | 78 | 34 | (78 x 34) / 100 | 27 |
The baked potato example is striking. With a high GI of 78 and a high carb content of 34 grams, it produces a GL of 27 – firmly in the high category. This makes a baked potato a significant blood sugar event, especially when eaten alone without fat or protein to slow digestion.
Key Differences Between Glycaemic Index and Glycaemic Load
Now that you understand both metrics individually, let us clearly outline how they differ. The differences go beyond just the definition and affect how you should use each metric in your daily life.
Difference 1: Serving Size Consideration
This is the most critical difference. GI uses a standardized test portion of 50 grams of carbohydrate, regardless of how much you would normally eat. GL uses realistic, real-world serving sizes.
A carrot, for example, has a GI of about 47 when tested with the standard 50-gram carb portion. But you would need to eat roughly six large carrots to get 50 grams of carbs. A single carrot has a GL of only about 2, which is negligible.
Difference 2: Accuracy for Real-World Eating
- GI alone: Can mislabel healthy foods as “bad” (like watermelon or carrots).
- GL: Corrects for portion size and gives a truer picture of blood sugar impact.
- GI alone: Useful when comparing similar foods at equal carb amounts.
- GL: Useful when planning actual meals with realistic portions.
Difference 3: Practical Application
GI is most helpful when you are choosing between two similar foods. For example, if you are deciding between white rice (GI 73) and basmati rice (GI 58), GI tells you that basmati is the better choice for blood sugar control.
GL is most helpful when planning an entire meal. It tells you whether your total carbohydrate load from all foods on your plate will cause a significant blood sugar spike.
Difference 4: Daily Target Numbers
Nutrition researchers suggest these daily GL targets:
- Low total daily GL: Under 80 – associated with better weight management and blood sugar control.
- Moderate daily GL: 80 to 119 – acceptable for most healthy adults.
- High daily GL: 120 or more – associated with increased risk of metabolic diseases.
There is no equivalent “daily GI target” because GI is a property of individual foods, not a cumulative measure. You cannot add up GI values to get a meaningful daily number. This is another reason GL is more practical for meal planning.
Tip: Use GI when comparing similar food choices (brown rice vs white rice). Use GL when planning meals and portion sizes. The two metrics work best together, not in isolation.
Which Metric Should You Use for Better Health?
The short answer: use both, but prioritize glycaemic load. GL gives you a more complete and actionable picture of how food affects your blood sugar. GI remains useful for comparing the carbohydrate quality of similar foods.
Who Benefits Most from Understanding GI and GL?
- People with type 2 diabetes: Both metrics help manage post-meal blood sugar spikes. The International Diabetes Federation recommends using GL as part of carbohydrate counting.
- People with insulin resistance or prediabetes: Choosing low-GL foods consistently can improve insulin sensitivity over time.
- People trying to lose weight: A study in the American Journal of Clinical Nutrition found that low-GL diets led to greater weight loss than low-fat diets over 18 months.
- Athletes and active individuals: Timing high-GI foods around workouts can speed glycogen replenishment. Low-GI foods are better for sustained energy before exercise.
- Anyone seeking stable energy: Low-GL eating patterns reduce the blood sugar roller coaster that causes energy crashes and cravings.
A Simple Decision Framework
- Step 1: Check the GI of the food you are considering. If it is low (under 55), it is generally a safe choice.
- Step 2: If the GI is medium or high, check the GL for your intended serving size. If the GL is under 10, the food is still a reasonable choice in that portion.
- Step 3: If the GL is 20 or more, consider reducing the portion, pairing it with protein and fat, or choosing a lower-GL alternative.
- Step 4: Track your total daily GL. Aim to stay under 80-100 for optimal blood sugar management.
Foods That Score Well on Both GI and GL
Some foods naturally perform well on both metrics. These are the best choices for blood sugar control:
- Most non-starchy vegetables (broccoli, spinach, peppers, zucchini)
- Legumes (lentils, chickpeas, black beans, kidney beans)
- Most whole fruits (berries, apples, pears, oranges)
- Nuts and seeds (almonds, walnuts, chia seeds, flaxseeds)
- Whole grains in moderate portions (steel-cut oats, quinoa, barley)
- Dairy products (milk, yogurt – especially Greek yogurt)
Warning: Low GI does not automatically mean “healthy.” Chocolate has a low GI (around 40) because of its high fat content, but it is still calorie-dense and should not be considered a health food. Always consider the full nutritional profile.
Practical Tips for Using GI and GL in Your Daily Diet
Understanding the theory is only half the battle. Here are actionable strategies you can use right away to apply both metrics in your everyday meals.
Smart Food Swaps
Small swaps can dramatically reduce your meal’s overall GL without sacrificing taste or satisfaction:
- Swap white rice for cauliflower rice or quinoa to cut the GL by 50-70%.
- Choose steel-cut oats over instant oats. Steel-cut oats have a GI of about 42 compared to 79 for instant oats.
- Replace white bread with dense, whole-grain sourdough. The fermentation process lowers the GI.
- Use sweet potatoes instead of white potatoes. A medium sweet potato has a GL of about 17 versus 27 for a white potato.
- Snack on apple slices with almond butter instead of crackers. The fiber and fat combination produces a much lower GL response.
Meal Pairing Strategies
You can lower the effective GL of any meal by adding the right companion foods. According to research from the European Journal of Clinical Nutrition, adding certain macronutrients slows carbohydrate digestion significantly.
- Add protein: Pair carbs with chicken, fish, eggs, tofu, or legumes. Protein slows gastric emptying.
- Add healthy fats: Olive oil, avocado, nuts, and seeds reduce the rate of glucose absorption.
- Add acid: Vinegar, lemon juice, and fermented foods like kimchi lower the blood sugar response by up to 20-30%.
- Add fiber: Chia seeds, flaxseeds, psyllium husk, and non-starchy vegetables bulk up the meal and slow digestion.
Common Mistakes to Avoid
- Relying on GI alone: This causes you to unfairly avoid foods like watermelon and carrots that are perfectly healthy in normal portions.
- Ignoring total daily carbohydrate intake: Even low-GL foods add up if you eat excessive amounts throughout the day.
- Assuming “low GI” labels mean healthy: Some processed foods add fat or fiber to lower the GI while still being nutritionally poor.
- Forgetting about cooking methods: Al dente pasta has a lower GI than overcooked pasta. Cooking time and method change the GI value.
- Not considering food combinations: A food eaten alone has a different blood sugar effect than the same food eaten as part of a mixed meal.
Tip: The University of Sydney maintains a free online GI database at glycaemicindex.com. You can search for any food and get its tested GI value, making it easy to calculate GL for your portions.
Frequently Asked Questions
Can a food have a high GI but low GL?
Yes, absolutely. Watermelon is the classic example. It has a high GI of 76, but a standard serving contains only about 11 grams of carbohydrate, giving it a low GL of 8.
This means eating a normal portion of watermelon has minimal impact on your blood sugar despite its high GI ranking.
Is glycaemic load better than glycaemic index for diabetics?
Most diabetes researchers and organizations, including Diabetes UK, recommend using glycaemic load as the primary tool for meal planning. GL accounts for portion sizes, making it more accurate for predicting real-world blood sugar responses. However, using both metrics together provides the most complete picture for managing diabetes through diet.
How many points of glycaemic load should I aim for per meal?
A good target for most adults is to keep each meal’s total glycaemic load under 20. For a full day, aim for a total GL under 80 for blood sugar management, or under 100 for general healthy eating. People with diabetes or insulin resistance may benefit from keeping their daily GL even lower, around 60-70, as part of a comprehensive management plan.
Does cooking change the glycaemic index of food?
Yes, cooking can significantly alter a food’s GI. Generally, longer cooking times break down starches more completely, raising the GI. For example, al dente pasta has a GI of about 45, while overcooked pasta can reach 60 or higher.
Allowing cooked starchy foods like rice and potatoes to cool before eating can lower their GI by forming resistant starch, which digests more slowly.
Are glycaemic index and glycaemic load the same as counting carbs?
No, they are different tools that measure different things. Carb counting tracks the total grams of carbohydrates consumed. GI measures how quickly those carbs raise blood sugar.
GL combines both – it considers the carb amount and the speed of blood sugar rise together. For the most complete dietary strategy, many nutritionists recommend combining GL awareness with general carbohydrate counting, especially for people managing diabetes.
Final Thoughts
The glycaemic index vs glycaemic load debate comes down to one key insight: GL gives you a more practical and accurate picture of how food affects your blood sugar in real-world portions. While GI remains useful for comparing the carbohydrate quality of similar foods, GL should be your primary tool for meal planning and dietary decisions. By understanding both metrics and applying them together, you can make informed food choices that support stable blood sugar, sustained energy, and long-term metabolic health.